
Process improvement project - Analyze -
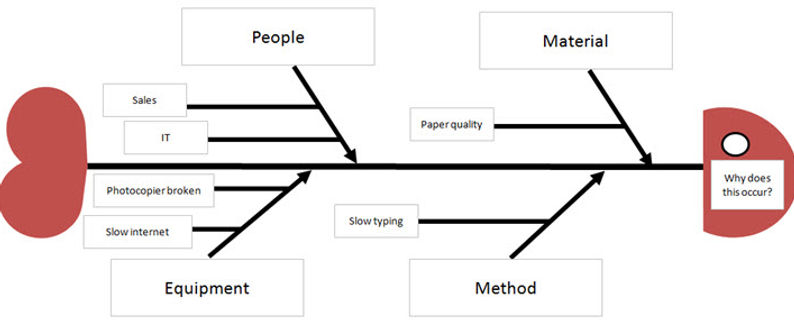
Also known as Cause & Effect Diagram.
A useful way of grouping and presenting ideas from a brainstorm
What are the possible causes of this effect?
This is similar to Affinity Diagram, and uses post-its, but has a narrower more focused issue statement
STEP 1 -
Create your categories of Causes. Examples are People, Equipment, Method, Materials and Environment
fish-bone diagram


STEP 2 -
Using a shape similar to a fish skeleton, place your Issue statement in the head of the fish on the right side. You can phrase it as a question e.g. “What are the causes of…”, or “Why does this occur?”

STEP 3 -
Depending on the number of categories listed in step 1, add the number of fish bones and insert the headings


CAN'T FIND WHAT YOU ARE LOOKING FOR? CONTACT US HERE

STEP 4 -
Place the brainstormed ideas (causes) under the categories
STEP 5 -
For each possible cause, ask the question “why does this happen?” List the responses off from the brainstormed ideas in step 4 to create smaller bones
STEP 6 -
To help with the previous step, use the 5 Whys tool to help
STEP 7 -
Now the diagram is complete, look for possible causes that appear repeatedly, and to identify where you need to gather data as a measurement
STEP 8 -
As you measure the data for each cause, you can update the diagram to indicate if it is a True cause, or not. A Scatter diagram is useful to complete this step.